A look at GPU monitoring in Windows 10
GPU performance statistics is not the concern of everyone. Graphics designers and animators care about it. Video game developers can’t ignore these metrics. Some PC gamers also like to know how much strain does the game/app X put on their GPU.
Microsoft had never bundled in-house GPU management tools before W10. Thankfully, third party tools have always been there for the rescue. Now that we have one more candidate for the purpose, we look at some of the existing players in the market and what details they have to offer before looking at the task manager’s GPU enhancements.
With no time to burn, let’s begin!
GPU-Z
The go-to application for most windows users out there. GPU-Z by Tech Power Up is a free GPU monitoring software for windows. This nifty application provides all the information an average user might need and would satisfy organizational needs as well depending their concerns. Besides the well detailed hardware information and real time clock and load and memory statistics, GPU-Z also displays fan speed, temperature, etc.
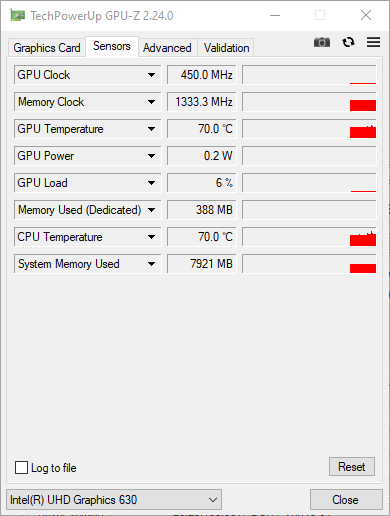
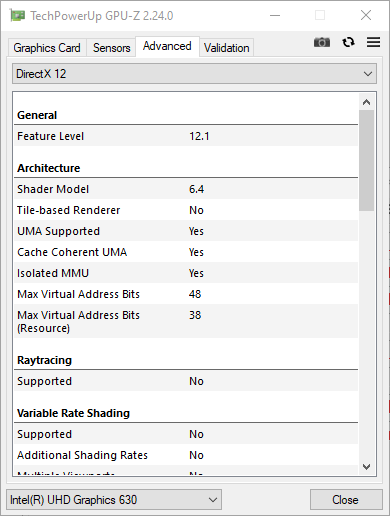
The application has 4 tabs. Namely Graphics card, Sensors, Advanced and Validation. Validation tab proffers nothing but a form for you to validate the data displayed. Other tabs are described below.

Graphics Card
This tab probably displays all the details of the installed GPUs that an average user might need. More than necessary technical details for most people. The details range from Your GPU maker and its model to driver version installed with most software and hardware related data included like BIOS version, Device ID, GPU Clocks (Including 3D clocks), memory, memory Type, shaders and supported system APIs like DirectX Version, OpenCL, CUDA etc.

Sensors
This is where graphs and the real-time stats show up. The sections are easy to understand. Sensors tab gives you live GPU clocks speed metrics, memory usage, temperature, fan speed, GPU Load %, and some more graphs that I don’t understand.

Advanced
This section gives you deeper details about your GPUs API support and limitations. For example you can check your GPU’s power and ideal temperature limitations, Pin point DirectX subversions thats supported, find out CUDA cores, cache sizes.
GPU Temp
Never heard of this one before ? Me neither. Regardless, I’m bringing this on the table because this displays just the right amount of data an early stage geek would need. No, our requirements don’t terminate at temperature details. Don’t fall for the name, GPU Temp monitors GPU temperature and loads. The freeware also plots graphs for the temperature. Only in Celsius though. load details include the standard monitors viz GPU Load, memory, Video engine and Memory controller.

Windows Task Manager
The windows task manager has been there since forever, in all versions of windows (atleast all those that I’ve used). The most popular purpose of the tool is to try to KILL those annoying unresponsive windows that just won’t listen to you. Well, in most cases they don’t listen to the task manager either but we trust it to be able to handle the situation better anyway.
For sure that’s not the only function of the tool. Task manager has always enabled one to monitor performance and resilience to stress by the system, for example CPU usage, Memory space, disk I/O, etc. Windows after a long while, gave some light to the task manager’s development with W10 fall creators update and brought in some visible changes. Addition of GPU monitoring panel in fall creators update was one of them.
One should note that the task manager only supports GPUs running WDDM 2.0 or higher. WDDM(Windows Display Driver Model) is the graphic driver architecture for video card drivers running Windows vista and newer. So, to the task manager the video cards present up with a common interface even though the actual GPU architecture is not unified and is dependent on the maker. Checking for your WDDM version is easy. Open dxdiag(DirectX Diagnostic tool) and look for Driver Model under the display tab.
Back to the task manager. Much like the other modules, GPU panel is pretty simple and displays the important stuff for most users. The most important being % Utilization obviously, much like what’s considered in the case of a CPU. But GPUs aren’t CPUs, besides the architectural differences they also have their own dedicated Video Memory in most cases (or they eat up some from your regular memory and call it their own), that is what differentiates your dedicated graphics from the integrated graphics chip.
In that case, a % Utilization and a Memory usage graph are sufficient for monitoring the performance, Right? Pretty much. For an average system user.

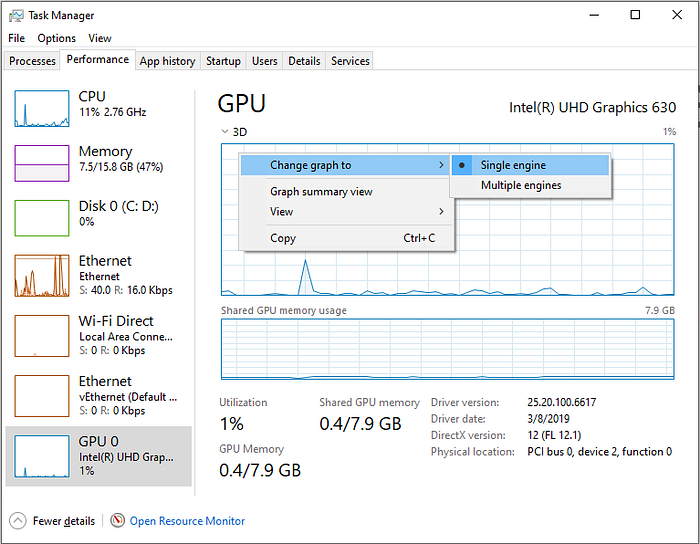
Oh well, the task manager has more than two graphs. But don’t be fooled by the 4 graphs you see. There’s more actually and one can switch the graph(called engine) by clicking on the down arrow right next to it’s header.

It is also possible to change the graph view to a single engine by right clicking on the graph/engine and selecting single engine from the menu. The section includes information regarding the GPU engines, not individual GPU cores. (a GPU engine is made up of many GPU cores. A lot more than what can be graphed in a single window.)

Below the processing engines are present the memory engines. Both shared and dedicated memory if the GPU uses two. Shared memory displays the memory consumed by the GPU from your primary memory. Dedicated memory of course is the GPU’s own personal space.
Below the memory engines you’ll find some GPU information. Which tells you the driver version, Direct X version support, Physical date and the GPU computer and memory utilization information. Okay, you may wonder with so many engines and graphs how is the single utilization percentage calculated for the left panel? Well, it’s not the 3D engine as I had guessed. Nor it is the aggregation of all the engines. It’s just the max utilization from any of those engines, and that’s what’s graphed into the left panel.
Process Tab
In addition to the GPU tab showing aggregated GPU’s processing engines, the windows task bar also adds a GPU performance column under the “Process” tab. This allows you to find the culprit eating up your GPU compute resource. This is supplemented by GPU Engine column which tells you the particular GPU being utilized.
Details Tab
When the GPU memory used by each of the process is in question, you’d have to look at the details tab. This tab adds Shared and Dedicated GPU memory to the scene, along with the same GPU and GPU Engine columns from Process tab.

Sidebar Diagnostics
Another unpopular application. This one isn’t a standalone software like the guys above, Sidebar diagnostics is a simple sidebar for windows which shows statics of all the major system hardware. It monitors CPU, RAM, GPU, network, and logical drives. The sidebar relies on open hardware monitor for data.
The main pro is it can be stacked on top with or without space reserved while you’re running the graphics intensive program. The sidebar also shows detailed graphs for different hardware's and its all configurable. You decide what it shows, how it shows. Not extremely configurable though, pasta chart is not an option, nor is a thing.
A bonus: it displays time.
Summary
GPU analysis and bench-marking tools have been present for a while. Plenty of them are pretty popular and are regularly used today by various individuals and organizations. They come in all shapes and sizes. You’ll find them integrated into the graphics intensive apps, you can have a desktop widget displaying the system metrics at all times, your graphics drivers might have come with it monitoring tool inside and then there are standard desktop apps.
GPU-Z has been a go-to application all this while for GPU monitoring. Following the name convention and application design of the other popular tool, CPU-Z, which also provides GPU information but is not covered as its brother app GPU-Z is more dedicated for the task. And of course windows task manager’s GPU panel is a welcome feature and sure is vital for a system monitoring/management tool.
Linux on the other hand, has a scarcity of GPU monitoring tools, and even the available options are mostly experimental and incomplete. Thus, I intend to push this article to know what all metrics does a user find useful for GPU stats as I plan to work on a GPU monitoring tool on Linux.
That’s it for the GPU exploration for this article’s span. I would love to know how everyone else monitors their GPU and what all metrics do you think are essential for a basic GPU monitor software. Any other comments are also welcome.
Peace
